2
ARTICLE
記事
2
ARTICLE
記事
Directions: Read the following article aloud.
課題: 以下の記事をはっきりとした声で音読しましょう。

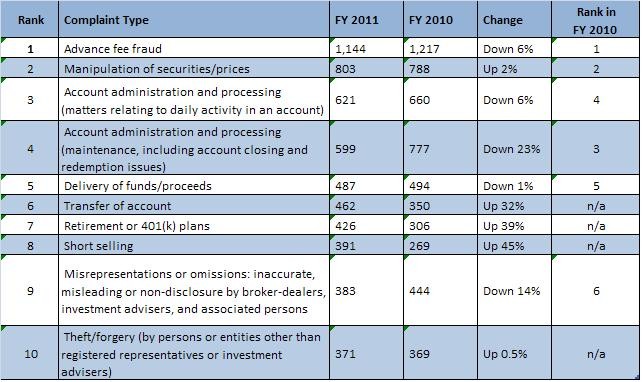
FY 2011 Annual Complaint Data
During FY 2011, SHL closed 33,632 files relating to complaints, questions, and other contacts received from investors. Comparable data for prior fiscal years is not available due to a change in reporting methodology.
TEN MOST COMMON COMPLAINTS
Directions: First repeat after your tutor and then read aloud by yourself.
Directions: Read the questions aloud and answer them.
課題: 質問を声に出して読んだ後、答えてみましょう。
1. Which customer complaint increased the most compare to the previous year?
2. Which customer complaint decreased the most compare to the previous year?
3. Which of one of these complaints do you think is the worst? Why?
4. Describe a time when you filed for a complaint.